

| Citation: |
Zabidi Abu Hasan, R. U. Gobithaasan, Roslan Hasni. ASSESSING PERIODICITY IN TIME SERIES DATA USING PERSISTENT HOMOLOGY[J]. Journal of Applied Analysis & Computation, 2027, 17(2): 1413-1453. doi: 10.11948/20250083

|
ASSESSING PERIODICITY IN TIME SERIES DATA USING PERSISTENT HOMOLOGY
-
Abstract
Topological Data Analysis (TDA), a novel method rooted in algebraic topology, offers a powerful framework for quantifying the structure of high-dimensional datasets. This study focuses on Persistent Homology (PH), a key TDA method, to elucidate the underlying shape and structure of time series data, thereby facilitating the understanding of patterns and recurrence. By employing Takens’ embedding to represent the time series as a high-dimensional point cloud, this approach effectively encodes its topological characteristics, particularly periodicity. We utilize various PH summaries, in the form of persistence vectors (PV), to assess periodicity by quantifying connected components $(H_0)$ and one-dimensional holes $(H_1)$. The methodology is validated on ten synthetic datasets, each comprising 200 data points and exhibiting varying levels of periodicity, amplitude, and frequency. The optimal window size for the sliding window embedding is determined by maximizing the $PD_{\text{max}}$ score. Subsequently, the $L^1$-norm of the PVs is computed to quantify periodicity. Under optimal window selection $(D=14)$, the cosine signal achieves the highest periodicity, followed by damped cosine and linear trend. Formal quantitative stability analysis identifies one of the two Sliding Window 1-Persistence Scoring (SW1PerS) baselines, SW2, as the most stable representation under both Gaussian noise (Rank Instability Index, RII$=0.243$) and missing data (Mean Absolute Rank Deviation, MARD=0.117), with the Persistence Landscape Score (PLS) and SW1 ranking closely behind; differences under noise are not statistically significant (Friedman $p=0.42$), while those under missing data are significant $(p=0.001)$. A comparison against non-topological baselines (FFT-based spectral entropy, autocorrelation, and recurrence quantification analysis) demonstrates that PLS achieves Kendall $\tau=0.867$, substantially outperforming spectral entropy (SE: $\tau=0.733$) which is the only non-topological baseline that achieves statistically significant concordance $(p=0.002)$, while the autocorrelation peak ratio (APR: $\tau=-0.289$) and recurrence rate (RR: $\tau=-0.200$) yield non-significant negative concordance on these synthetic signals.
-

-
References
[1] H. Abdi and L. J. Williams, Principal component analysis, Wiley Interdisciplinary Reviews: Computational Statistics, 2010, 2(4), 433–459. doi: 10.1002/wics.101 [2] H. Adams, S. Chepushtanova, T. Emerson, E. Hanson, M. Kirby, F. Motta, R. Neville, C. Peterson, P. Shipman and L. Ziegelmeier, Persistence images: A stable vector representation of persistent homology, Journal of Machine Learning Research, 2015, 18, 1–35. [3] C. C. Aggarwal, A. Hinneburg and D. A. Keim, On the surprising behavior of distance metrics in high dimensional spaces, International Conference on Database Theory, 2001, 420–434. [4] D. Ali, A. Asaad, M.-J. Jimenez, V. Nanda, E. Paluzo-Hidalgo and M. Soriano-Trigueros, A survey of vectorization methods in topological data analysis, arXiv preprint, 2022, 1–26. [5] W. Altidor, T. M. Khoshgoftaar and A. Napolitano, Measuring stability of feature ranking techniques: A noise-based approach, International Journal of Business Intelligence and Data Mining, 2012, 7(1–2), 80–115. [6] H. Anai, F. Chazal, M. Glisse, Y. Ike, H. Inakoshi, R. Tinarrage and Y. Umeda, DTM-based filtrations, Abel Symposia, 2020, 15, 33–66. [7] N. Atienza, R. Gonzalez-Díaz and M. Soriano-Trigueros, On the stability of persistent entropy and new summary functions for topological data analysis, Pattern Recognition, 2020, 107. [8] D. Berrar, An empirical evaluation of ranking measures with respect to robustness to noise, Journal of Artificial Intelligence Research, 2014, 49, 241–267. doi: 10.1613/jair.4136 [9] G. Box, G. Jenkins, G. Reinsel and G. Ljung, Time Series Analysis: Forecasting and Control, 5th Edn, Wiley, Hoboken, NJ, 2015. [10] P. Bubenik, Statistical topological data analysis using persistence landscapes, Journal of Machine Learning Research, 2015, 16, 77–102. [11] P. Bubenik, M. Hull, D. Patel and B. Whittle, Persistent homology detects curvature, Inverse Problems, 2020, 36(2), 025008. doi: 10.1088/1361-6420/ab4ac0 [12] G. Carlsson, Topology and data, Bulletin of the American Mathematical Society, 2009, 46(2), 255–308. doi: 10.1090/S0273-0979-09-01249-X [13] P. Celik and E. Sefer, Analyzing transaction graphs via motif-based graph representation learning for cryptocurrency price prediction, Computational Economics, 2025, 1–22. [14] C. Chatfield, The Analysis of Time Series: An Introduction with R, 6th Edn, Chapman & Hall/CRC, Boca Raton, FL, 2004. [15] Y. M. Chung and A. Lawson, Persistence curves: A canonical framework for summarizing persistence diagrams, Advances in Computational Mathematics, 2022, 48(1), 1–30. doi: 10.1007/s10444-021-09917-z [16] J. Eckmann, S. Kamphorst and D. Ruelle, Recurrence plots of dynamical systems, Europhysics Letters, 1987, 4(9), 973–977. doi: 10.1209/0295-5075/4/9/004 [17] H. Edelsbrunner and J. Harer, Computational topology, Open Problems in Topology Ⅱ, 2010, 493–545. [18] S. Emrani, T. Gentimis and H. Krim, Persistent homology of delay embeddings, arXiv preprint, 2013, 1–14. [19] H. Gakhar and J. A. Perea, Sliding window persistence of quasiperiodic functions, arXiv preprint, 2021, 1–32. [20] M. Gidea, Topological data analysis of critical transitions in financial networks, Springer Proceedings in Complexity, 2017, 47–59. [21] M. Gidea, D. Goldsmith, Y. Katz, P. Roldan and Y. Shmalo, Topological recognition of critical transitions in time series of cryptocurrencies, Physica A: Statistical Mechanics and its Applications, 2020, 548, 123843. doi: 10.1016/j.physa.2019.123843 [22] M. Gidea and Y. Katz, Topological data analysis of financial time series: Landscapes of crashes, arXiv preprint, 2017. [23] M. Gidea and Y. Katz, Topological data analysis of financial time series: Landscapes of crashes, Physica A: Statistical Mechanics and its Applications, 2018, 491, 820–834. doi: 10.1016/j.physa.2017.09.028 [24] R. Gobithaasan, Z. A. Hasan, K. D. Selvarajh, K.-S. Wong, S. Mamat, M. Z. M. Ali, K. T. Miura and P. Dotko, Clustering selected Terengganu’s rainfall stations based on persistent homology, Thai Journal of Mathematics, 2022, 20(1), 197–211. [25] Z. A. Hasan and R. U. Gobithaasan, The characterization of rainfall data set using persistence diagram and its relation to extreme events: Case study of three locations in kemaman, terengganu, Soft Computing in Data Science, 2023, 261–274. [26] Z. A. Hasan, R. U. Gobithaasan, N. F. S. Mohd Zulkepli, M. Z. M. Ali, K. T. Miura and P. Dłotko, Identifying irregular rainfall patterns using persistent homology, Journal of Advanced Research in Applied Sciences and Engineering Technology, 2024, 35(1), 26–36. [27] A. Hatcher, Algebraic Topology, Cambridge University Press, Cambridge, UK, 2002. [28] T. Inouye, K. Shinosaki, H. Sakamoto, S. Toi, S. Ukai, A. Iyama, Y. Katsuda and M. Hirano, Quantification of EEG irregularity by use of the entropy of the power spectrum, Electroencephalography and Clinical Neurophysiology, 1991, 79(3), 204–210. doi: 10.1016/0013-4694(91)90138-T [29] M. S. Ismail, S. I. Hussain and M. S. M. Noorani, Detecting early warning signals of major financial crashes in bitcoin using persistent homology, IEEE Access, 2020, 8, 202042–202057. doi: 10.1109/ACCESS.2020.3036370 [30] M. S. Ismail, M. S. Md Noorani, M. Ismail, F. Abdul Razak and M. A. Alias, Predicting next day direction of stock price movement using machine learning methods with persistent homology: Evidence from kuala lumpur stock exchange, Applied Soft Computing Journal, 2020, 93, 106422. doi: 10.1016/j.asoc.2020.106422 [31] M. S. Ismail, M. S. M. Noorani, M. Ismail, F. A. Razak and M. A. Alias, Early warning signals of financial crises using persistent homology, Physica A: Statistical Mechanics and its Applications, 2022, 586, 126459. doi: 10.1016/j.physa.2021.126459 [32] A. Kalousis, J. Prados and M. Hilario, Stability of feature selection algorithms: A study on high-dimensional spaces, Knowledge and Information Systems, 2007, 12(1), 95–116. doi: 10.1007/s10115-006-0040-8 [33] M. G. Kendall and B. B. Smith, Rank Correlation Methods, Griffin, London, 1948. [34] M. B. Kennel and H. D. Abarbanel, False neighbors and false strands: A reliable minimum embedding dimension algorithm, Physical Review E - Statistical Physics, Plasmas, Fluids, and Related Interdisciplinary Topics, 2002, 66(2), 1–18. [35] L. I. Kuncheva, A stability index for feature selection, in Proceedings of the 25th IASTED International Multi-Conference on Artificial Intelligence and Applications, 2007, 390–395. [36] N. Marwan, M. C. Romano, M. Thiel and J. Kurths, Recurrence plots for the analysis of complex systems, Physics Reports, 2007, 438(5–6), 237–329. [37] Y. Mileyko, S. Mukherjee and J. Harer, Probability measures on the space of persistence diagrams, Inverse Problems, 2011, 27(12). [38] M. R. Muldoon, R. S. MacKay, J. P. Huke and D. S. Broomhead, Topology from time series, Physica D: Nonlinear Phenomena, 1993, 65(1–2), 1–16. [39] E. Munch, A user’s guide to topological data analysis, Journal of Learning Analytics, 2017, 4(2), 47–61. [40] J. R. Munkres, Elements of Algebraic Topology, Addison-Wesley, Menlo Park, CA, 1984. [41] A. Myers, E. Munch and F. A. Khasawneh, Persistent homology of complex networks for dynamic state detection, Physical Review E, 2019, 100(2). [42] J. A. Perea, Persistent homology of toroidal sliding window embeddings, in Proceedings of the IEEE International Conference on Acoustics, Speech and Signal Processing (ICASSP), 2016, 6435–6439. [43] J. A. Perea, A. Deckard, S. B. Haase and J. Harer, SW1PerS: Sliding windows and 1-persistence scoring; discovering periodicity in gene expression time series data, BMC Bioinformatics, 2015, 16, 257. doi: 10.1186/s12859-015-0645-6 [44] J. A. Perea and J. Harer, Sliding windows and persistence: An application of topological methods to signal analysis, Foundations of Computational Mathematics, 2015, 15(3), 799–838. doi: 10.1007/s10208-014-9206-z [45] G. Powell and I. Percival, A spectral entropy method for distinguishing regular and irregular motion of Hamiltonian systems, Journal of Physics A: Mathematical and General, 1979, 12(11), 2053–2071. doi: 10.1088/0305-4470/12/11/017 [46] R. Rabadán and A. J. Blumberg, Topological Data Analysis for Genomics and Evolution: Topology in Biology, Cambridge University Press, Cambridge, UK, 2019. [47] N. Ravishanker and R. Chen, Topological data analysis (tda) for time series, arXiv preprint, 2019, 1–29. [48] P. J. Rousseeuw and C. Croux, Alternatives to the median absolute deviation, Journal of the American Statistical Association, 1993, 88(424), 1273–1283. doi: 10.1080/01621459.1993.10476408 [49] V. D. Silva, P. Skraba and M. Vejdemo-Johansson, Topological analysis of recurrent systems, Workshop on Algebraic Topology and Machine Learning, NIPS, 2012, 2(1), 2–6. [50] S. M. S. Syed Musa, M. S. Md Noorani, F. Abdul Razak, M. Ismail, M. A. Alias and S. I. Hussain, Using persistent homology as preprocessing of early warning signals for critical transition in flood, Scientific Reports, 2021, 11(1), 1–14. doi: 10.1038/s41598-020-79139-8 [51] F. Takens, Detecting strange attractors in turbulence, in Dynamical Systems and Turbulence, Warwick 1980, 898 of Lecture Notes in Mathematics (Edited by D. Rand and L.-S. Young), Springer, Berlin, Heidelberg, 1981, 366–381. [52] C. J. Tralie and J. A. Perea, (Quasi)periodicity quantification in video data, using topology, SIAM Journal on Imaging Sciences, 2018, 11(2), 1049–1077. doi: 10.1137/17M1150736 [53] T. Tuncer, U. Kaya, E. Sefer, O. Alacam and T. Hoser, Asset price and direction prediction via deep 2d transformer and convolutional neural networks, in Proceedings of the Third ACM International Conference on AI in Finance, 2022, 79–86. [54] R. Turkeš, G. Montúfar and N. Otter, On the effectiveness of persistent homology, 2023. [55] K. Turner, Y. Mileyko, S. Mukherjee and J. Harer, Fréchet means for distributions of persistence diagrams, Discrete and Computational Geometry, 2014, 52(1), 44–70. doi: 10.1007/s00454-014-9604-7 [56] Y. Umeda, Time series classification via topological data analysis, Transactions of the Japanese Society for Artificial Intelligence, 2017, 32(3), 1–12. [57] Y. Uygun and E. Sefer, Financial asset price prediction with graph neural network-based temporal deep learning models, Neural Computing and Applications, 2025, 37(30), 25445–25471. doi: 10.1007/s00521-025-11586-8 [58] A. Wehrl, General properties of entropy, Reviews of Modern Physics, 1978, 50(2), 221–260. doi: 10.1103/RevModPhys.50.221 [59] N. F. S. Zulkepli, M. S. Md Noorani, F. A. Razak, M. Ismail and M. A. Alias, Cluster analysis of haze episodes based on topological features, Sustainability (Switzerland), 2020, 12(10). [60] N. F. S. Zulkepli, M. S. M. Noorani, F. A. Razak, M. Ismail and M. A. Alias, Topological characterization of haze episodes using persistent homology, Aerosol and Air Quality Research, 2019, 19(7), 1614–1621. doi: 10.4209/aaqr.2018.08.0315 -
-
Figures(19) / Tables(16)
Export File
Citation
Zabidi Abu Hasan, R. U. Gobithaasan, Roslan Hasni. ASSESSING PERIODICITY IN TIME SERIES DATA USING PERSISTENT HOMOLOGY[J]. Journal of Applied Analysis & Computation, 2027, 17(2): 1413-1453. doi: 10.11948/20250083
Format
Content
 DownLoad:
-
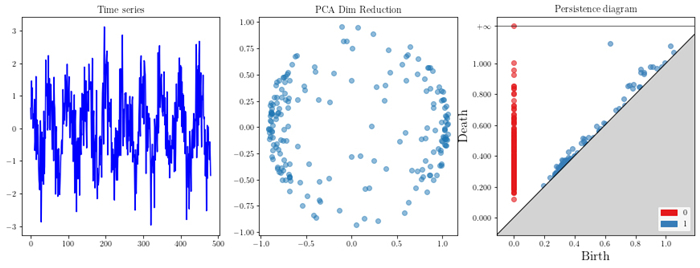
Figure 1.
Example of PD construction using 200 points with
$ H_0 $ $ H_1 $ -
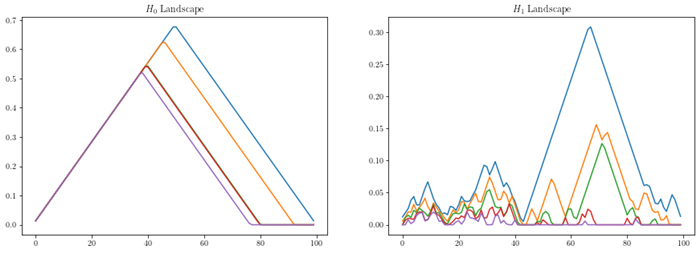
Figure 2.
PL representation from PD in equation (2.5).
-
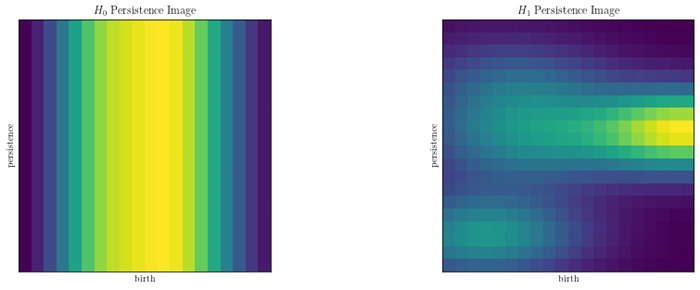
Figure 3.
Persistent Image (PI) representation from PD in equation (2.5). Left is PI for
$ H_0 $ $ H_1 $ -
Figure 4.
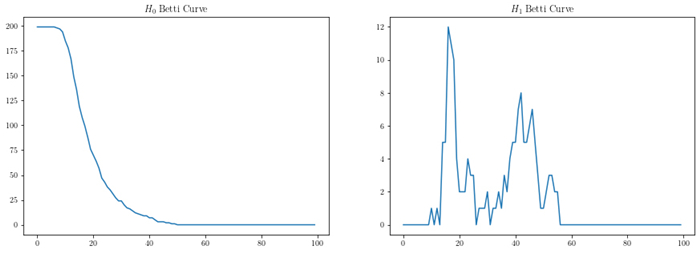
Betti curve representation from PD in equation (2.5).
-
Figure 5.
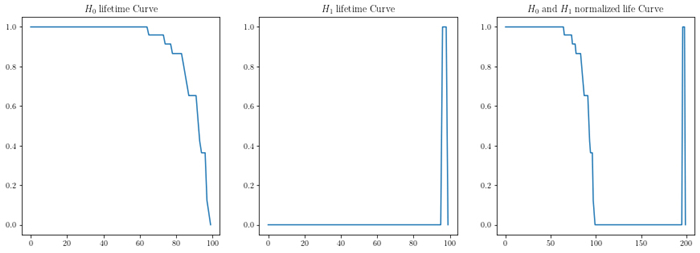
Lifetime curve (LC) representation from PD in equation (2.5). Left is the LC for
$ H_0 $ $ H_1 $ $ H_0 $ $ H_1 $ -
Figure 6.
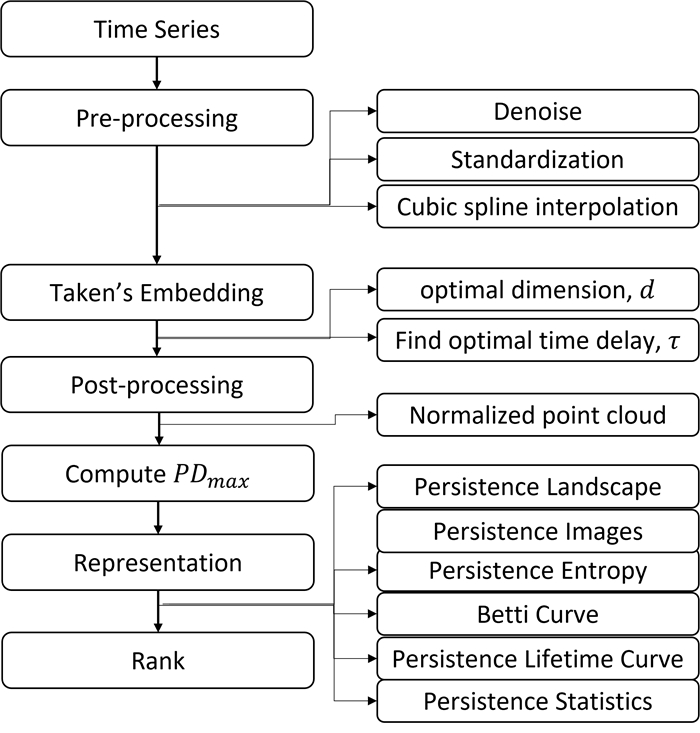
Workflow to measure the periodicity score.
-
Figure 7.
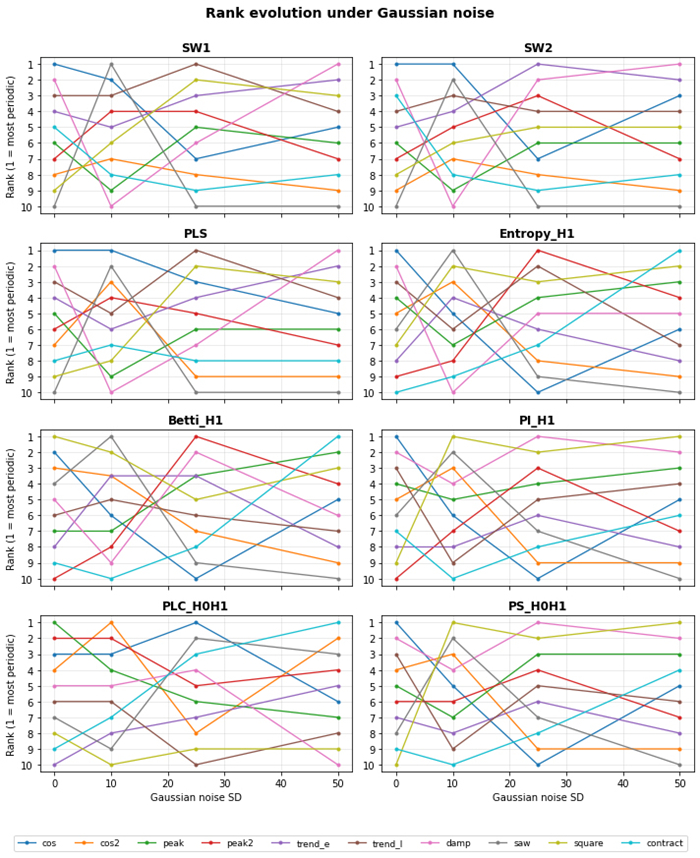
The rank plot of PV with Gaussian noise (SD(%)=0, 10, 25, 50) with embedding dimension
$ D=14 $ $ w=93 $ -
Figure 8.
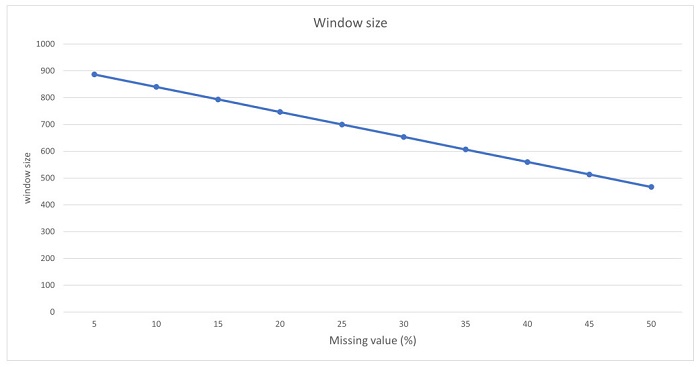
The fixed different optimal window size used for missing values data with embedding dimension
$ D=14 $ -
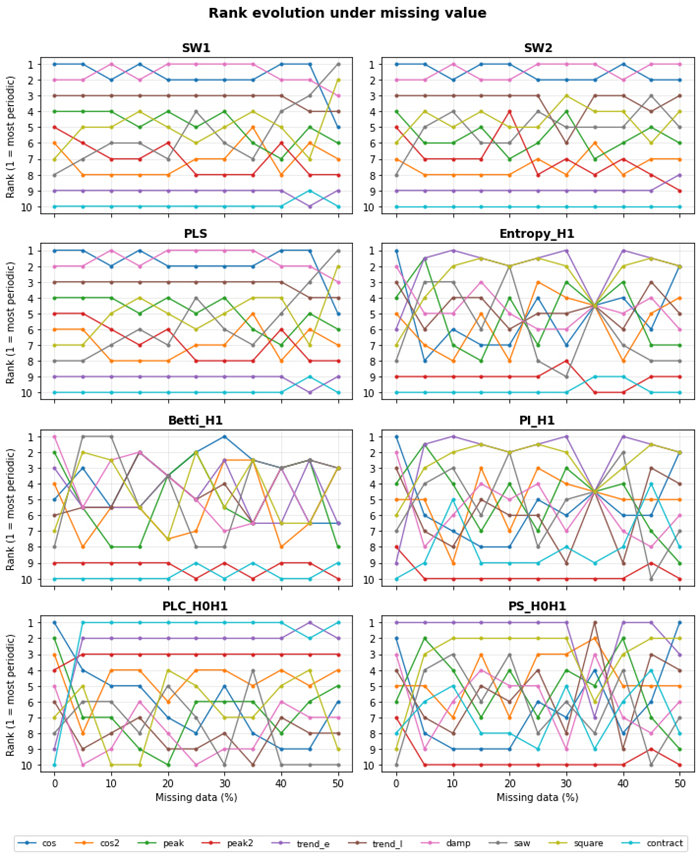
Figure 9.
The rank plot PV with missing value (mv(%)=0, 5, 10, 15, 20, 25, 30, 35, 40, 45, 50) with embedding dimension
$ D=14 $ -
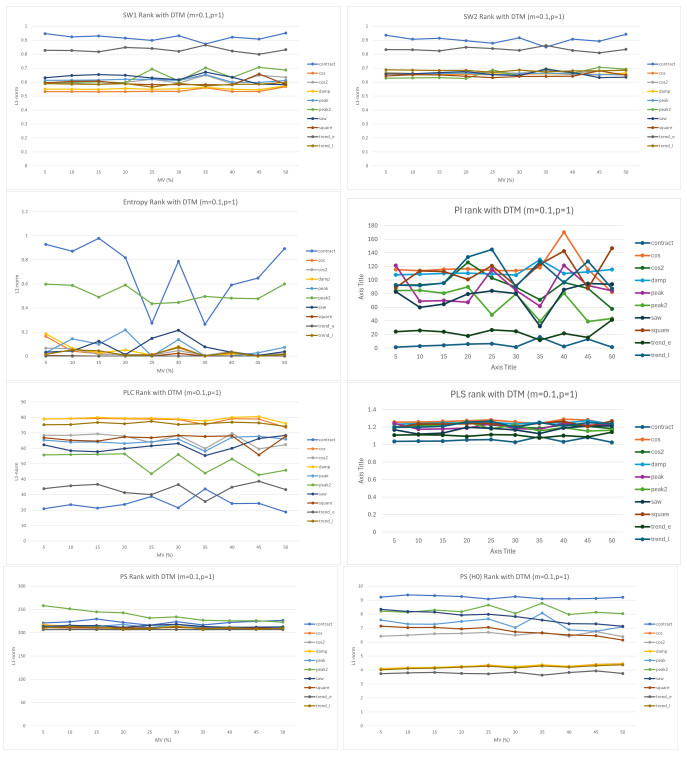
Figure 10.
The rank plot PV using DTM
$ (m=0.1 , \; p=1) $ $ D=14 $ -
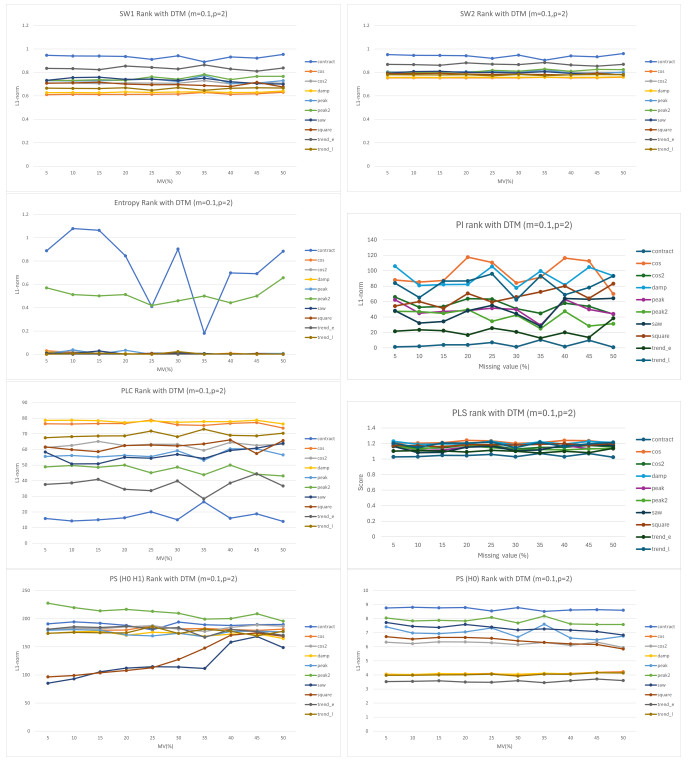
Figure 11.
The rank plot PV using DTM
$ (m=0.1 , \; p=2) $ $ D=14 $ -
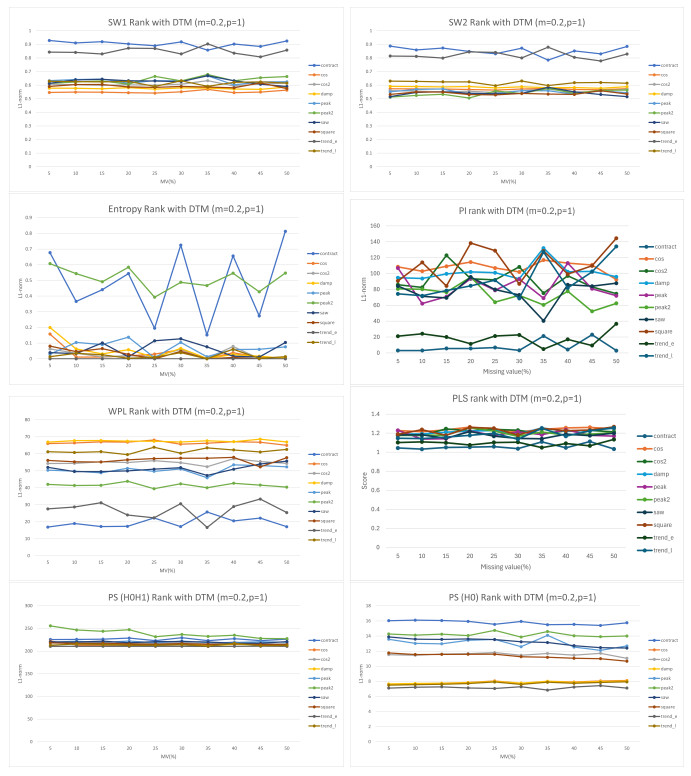
Figure 12.
The rank plot PV using DTM
$ (m=0.2 , \; p=1) $ $ D=14 $ -
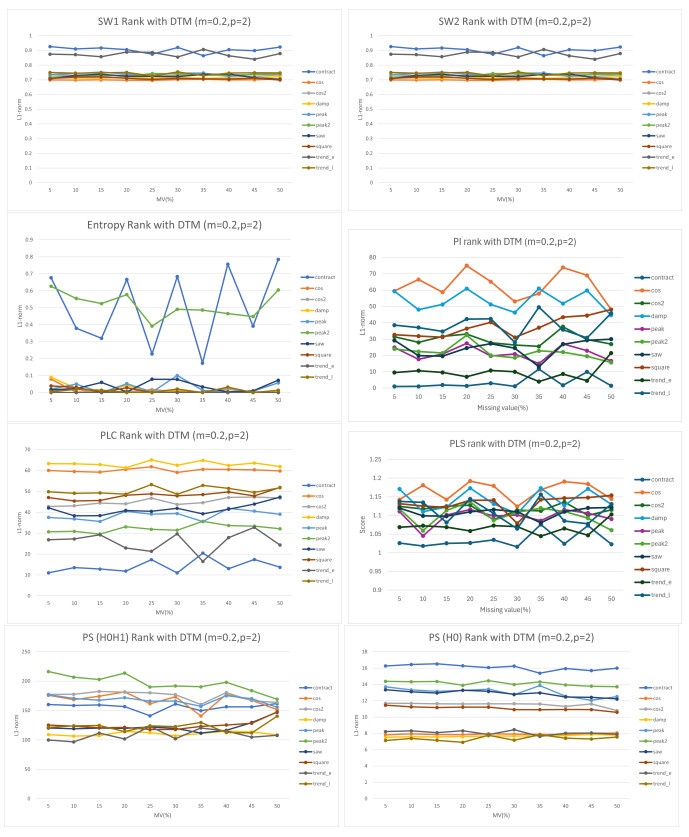
Figure 13.
The rank plot PV using DTM
$ (m=0.2 , \;p=2) $ $ D=14 $ -
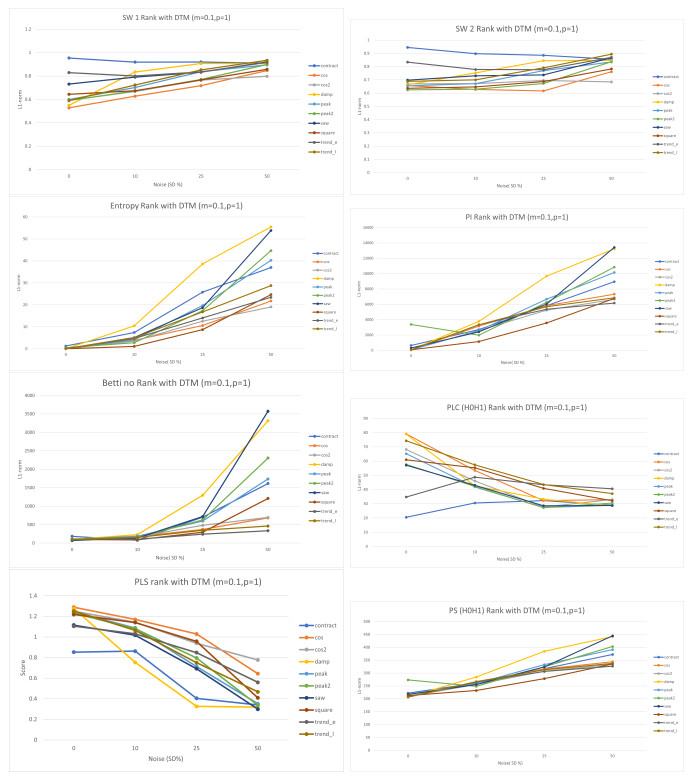
Figure 14.
The rank plot PV using DTM
$ (m=0.1 , p=1) $ $ D=14 $ -
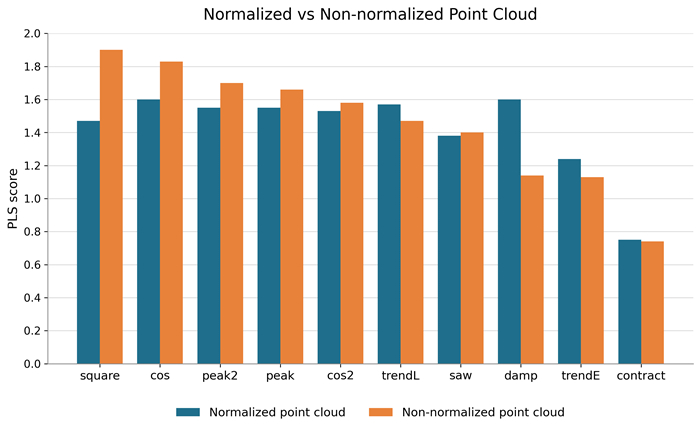
Figure 15.
The PLS score plot for normalized and non-normalized point cloud with
$ w=93 $ -
Figure 16.
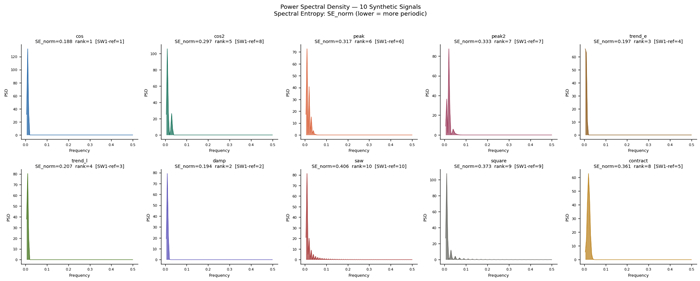
Power Spectral Density (PSD) for all ten synthetic signals, computed via Hann-windowed periodogram. The annotated SE_norm value (lower = more periodic) and rank are shown for each signal. Method: Spectral Entropy [28, 45].
-
Figure 17.
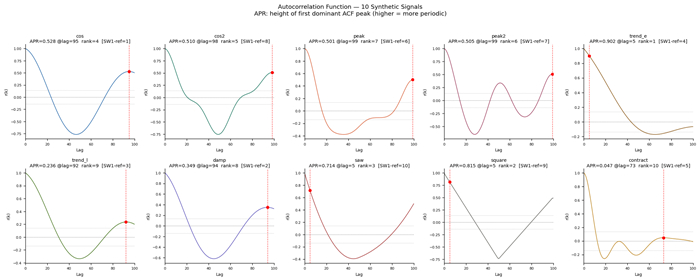
Autocorrelation function (ACF) for all ten synthetic signals. The red dashed vertical line and dot mark the dominant ACF peak (APR value). Gray dotted lines indicate the 95% confidence interval
$ (\pm1.96/\sqrt{N}) $ -
Figure 18.
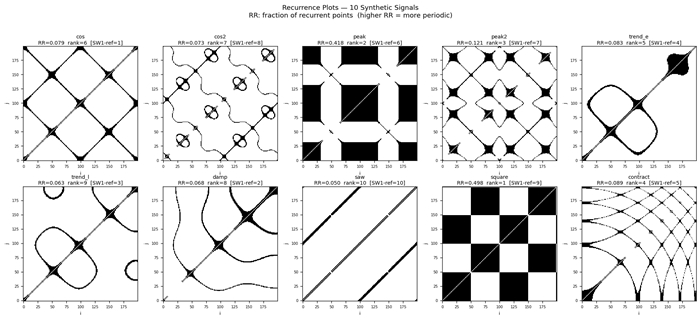
Recurrence plots for all ten synthetic signals
$ (\varepsilon=0.10\,\sigma_x $ $ m=1 $ $ \tau=1) $ -
Figure 19.
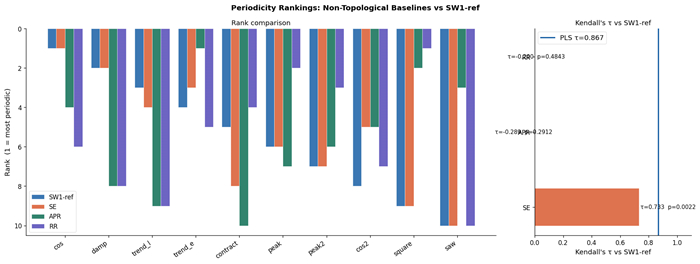
Left: Periodicity rank comparison among SW1-ref, SW1, SE, APR, and RR (rank 1 = most periodic). Right: Kendall’s τ against SW1-ref for each method. The blue dashed line marks PLS
$ \tau=0.867 $