
| Citation: |
Meili Li, Xian Zhang, Wei Ding, Junling Ma. ESTIMATING THE MOSQUITO DENSITY IN GUANGZHOU CITY, CHINA[J]. Journal of Applied Analysis & Computation, 2023, 13(1): 329-343. doi: 10.11948/20220129

|
ESTIMATING THE MOSQUITO DENSITY IN GUANGZHOU CITY, CHINA
-
Abstract
Mosquito is a vector of many diseases. Predicting the trend of mosquito density is important for early warning and control of mosquito diseases. In this paper, we fit a discrete time mosquito model developed by Gong et al. in 2011, which considers the immature and adult stages, and weather dependent model parameters, to the Breteau Index and Bite Index data for Aedes aegypti in Guangzhou city, China in 2014, as well as the weather data for average temperature, precipitation, evaporation and daylight for the same period. We estimated the model parameters using the Markov Chain Monte-Carlo (MCMC) method. We find that many parameters are not identifiable. We revise and simplify the model so that the parameters of our new model are identifiable. Our results indicate that the model predicted mosquito prevalence agrees well with data. We then use the fitted parameter values against the Breteau Index and Bite Index data for Guangzhou city in 2017 and 2018, and show that the estimated parameter values are applicable for other seasons.
-
Keywords:
- Weather /
- mosquito density /
- parameters estimation /
- Markov chain monte-carlo
-

-
References
[1] S. Bhatt, P. W. Gething, O. J. Brady, et al., The global distribution and burden of dengue, Nature, 2013, 496(7446), 504–507. doi: 10.1038/nature12060 [2] O. J. Brady, P. W. Gething, S. Bhatt, et al., Refining the global spatial limits of dengue virus transmission by evidence-based consensus, PLoS Neglected Tropical Diseases, 2012, 6(8), 1–15. [3] V. Brower, Vector borne diseases and global warming are both on an upward swing?, EMBO reports, 2001, 2(9), 755–757. doi: 10.1093/embo-reports/kve193 [4] L. F. Chaves, A. C. Morrison, U. D. Kirtron, et al., Nonlinear impacts of climate variability on the density-dependent regulation of an insect vector of disease, Global Change Biology, 2012, 18(2), 457–468. doi: 10.1111/j.1365-2486.2011.02522.x [5] Convenient Inquiry Network, Sunrise and sunset timetable in guangzhou city, https://richurimo.bmcx.com/guangzhou__richurimo/. [6] Chinese Software Develop Net, Daily data set of surface climatic data in china, https://download.csdn.net/download/weixin_41069650/12096058?utm_source=iteye_new. [7] A. Githeko, S. Lindsay, U. Confalonieri, et al., Climate change and vector borne diseases: a regional analysis, Bulletin of the World Health Organization, 2000, 78(9), 1136–1147. [8] H. Gong, A. T. DeGaetano and L. C. Harringto, Climate-based models for west nile culex mosquito vectors in the northeastern us, International Journal of Biometeorology, 2011, 55(3), 435–446. doi: 10.1007/s00484-010-0354-9 [9] Guangzhou Center for Disease Control and Prevention, Daily report of mosquito vector density monitoring in guangzhou city, http://www.gzcdc.org.cn/news/index.html?page=151. [10] P. Jia, L. Lu, X. Chen, et al., A climate-driven mechanistic population model of aedes albopictus with diapause, Parasites & Vectors, 2016, 9(1), 1–15. [11] J. Lu and J. Li, Dynamics of stage-structured discrete mosquito population models, Journal of Applied Analysis and Computation, 2011, 1(1), 53–67. doi: 10.11948/2011005 [12] Y. Nagao, U. Thavara, P. Chitnumsup, et al., Climatic and social risk factors for aedes infestation in rural thailand, Tropical Medicine and International Health, 2003, 8(7), 650–659. doi: 10.1046/j.1365-3156.2003.01075.x [13] M. Otero, H. G. Solaril and N. Schweigmann, A stochastic population dynamics model for aedes aegypti: formulation and application to a city with temperate climate, Bulletion of Mathematical Biology, 2006, 68(8), 1945–1974. doi: 10.1007/s11538-006-9067-y [14] L. M. Rueda, K. J. Patel, R. C. Axtell, et al., Temperature-dependent development and survival rates of culex quinquefasciatus and aedes aegypti (diptera: culicidae), Journal of Medical Entomology, 1990, 27(5), 892–898. doi: 10.1093/jmedent/27.5.892 [15] A. Spielman, Structure and seasonality of nearctic culex pipiens populations, Annals of New York Academy of Science, 2001, 951(1), 220–234. [16] F. Tanser, B. Sharp and D. L. Sueur, Potential effect of climate change on malaria transmission in africa, The Lancet, 2003, 362(9398), 1792–1798. doi: 10.1016/S0140-6736(03)14898-2 [17] A. Tran, G. L'Ambert, G. Lacour, et al., A rainfall- and temperature-driven abundance model for aedes albopictus populations, International Journal of Environmental Research and Public Health, 2013, 10(5), 1698–1719. doi: 10.3390/ijerph10051698 [18] J. J. Waggoner, L. Gresh, M. J. Vargas, et al., Viremia and clinical presentation in nicaraguan patients infected with zika virus, chikungunya virus, and dengue virus, Clinc. Inf. Dis., 2016, 63(12), 1584–1590. doi: 10.1093/cid/ciw589 [19] X. Wang, S. Tang and R. A. Cheke, A stage structured mosquito model incorporating effects of precipitation and daily temperature fluctuations, Journal of Theoretical Biology, 2016, 411, 27–36. doi: 10.1016/j.jtbi.2016.09.015 [20] M. Wong, H. Y. Mok, H. Ma, et al., A climate model for predicting the abundance of aedes mosquitoes in hong kong, Meteorological Applications, 2011, 18(1), 105–110. [21] Y. Xue, L. Hu and L. Nie, Modelling the wolbachia strains for dengue fever virus control in the presence of seasonal fluctuation, Journal of Nonlinear Modeling and Analysis, 2021, 3(2), 209–224. -
-
Figures(9) / Tables(6)
Export File
Citation
Meili Li, Xian Zhang, Wei Ding, Junling Ma. ESTIMATING THE MOSQUITO DENSITY IN GUANGZHOU CITY, CHINA[J]. Journal of Applied Analysis & Computation, 2023, 13(1): 329-343. doi: 10.11948/20220129
Format
Content
 DownLoad:
-
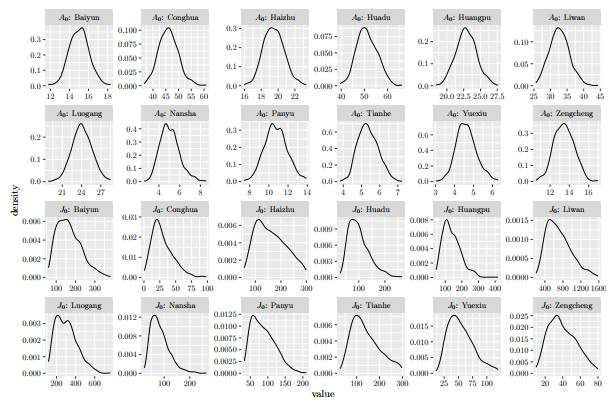
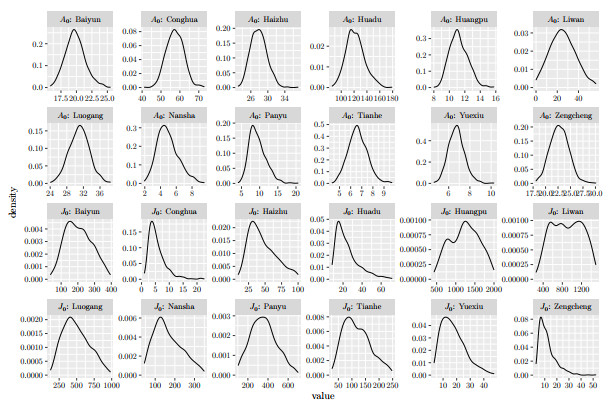
Figure 1.
The posterior distributions of initial values of Model (2.1) for the 12 districts in Guangzhou city.
-
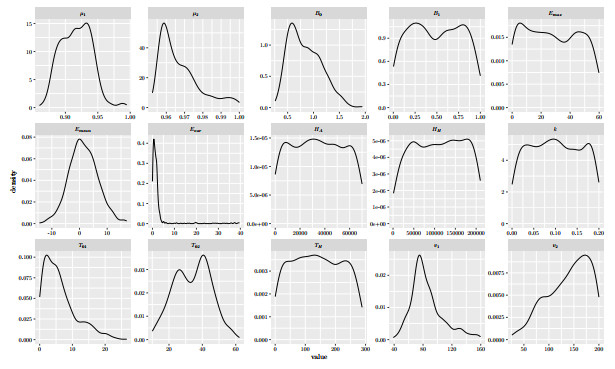
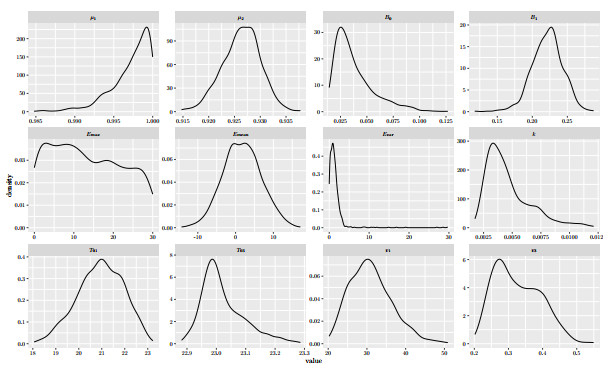
Figure 2.
The posterior distributions of the parameters of Model (2.1).
-
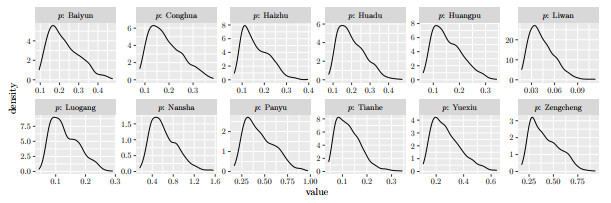
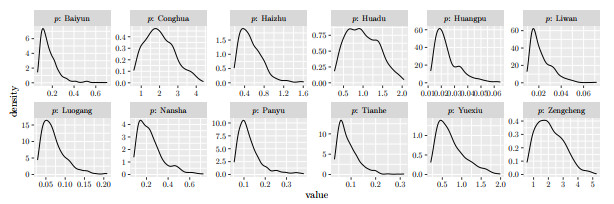
Figure 3.
The posterior distributions of capture probability ratios of Model (2.1) for the 12 districts in Guangzhou city.
-
Figure 4.
The posterior distributions of initial values of Model (3.1) for the 12 districts in Guangzhou city.
-
Figure 5.
The posterior distributions of parameters of Model (3.1).
-
Figure 6.
The posterior distributions of capture probability ratios of Model (3.1) for the 12 districts in Guangzhou city.
-
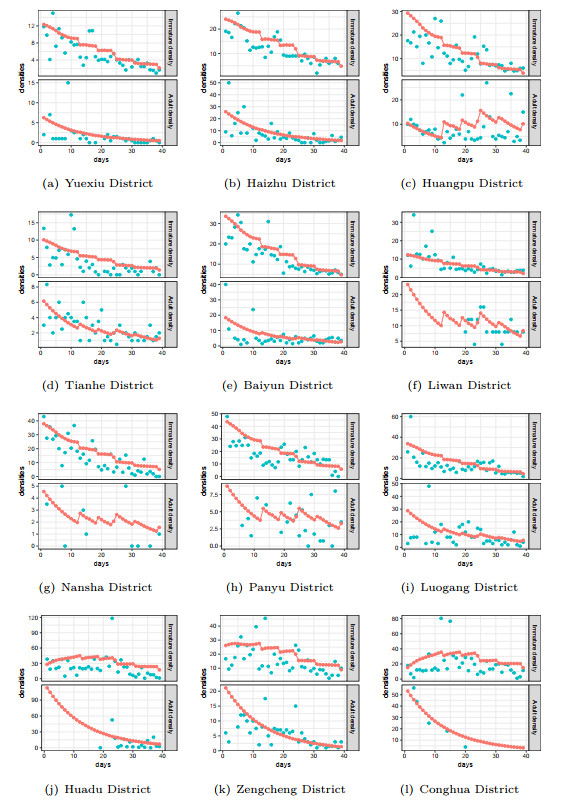
Figure 7.
The comparison of the predicted mosquito density (red dots) with the Breteau Index and Bite Index for 12 districts in Guangzhou city in 2014 (blue dots).
-
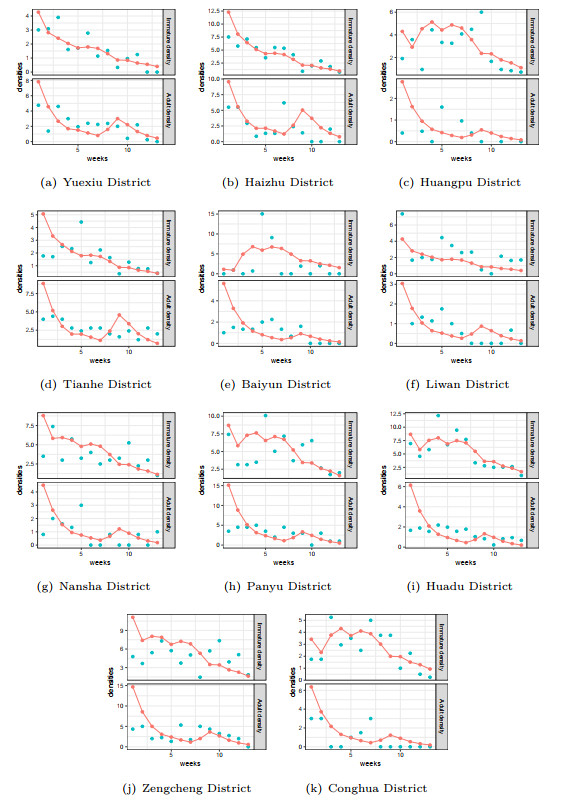
Figure 8.
The comparison of the predicted mosquito density (red dots) with the Breteau Index and Bite Index for 11 districts in Guangzhou city in 2017 (blue dots).
-
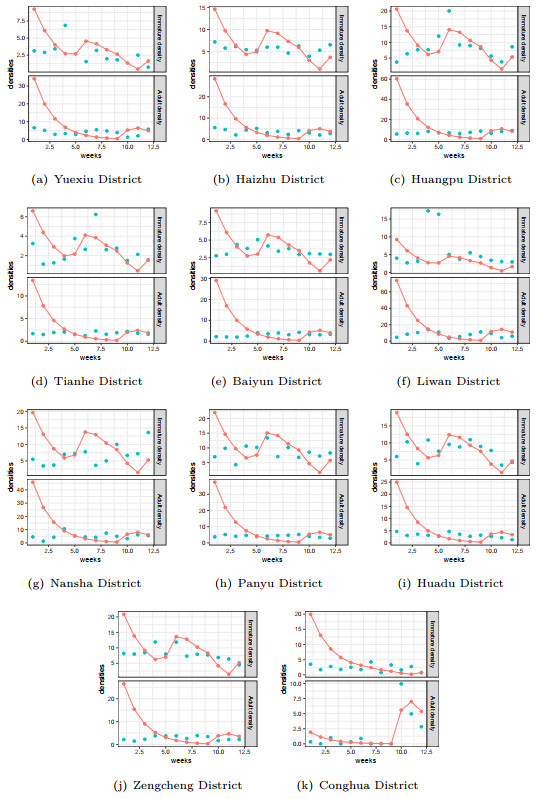
Figure 9.
The comparison of the predicted mosquito density (red dots) with the Breteau Index and Bite Index for 11 districts in Guangzhou city in 2018 (blue dots).